
When you’re investigating a potentially compromised Windows endpoint, the last thing you need is another tool that dumps endless raw output into a console window and calls it “forensics.”
You need the suspicious service that shouldn’t be there. The scheduled task that doesn’t belong. The odd TCP listener waiting for connections. The registry persistence key that explains why malware keeps coming back.
Most importantly, you need all of it in one place.
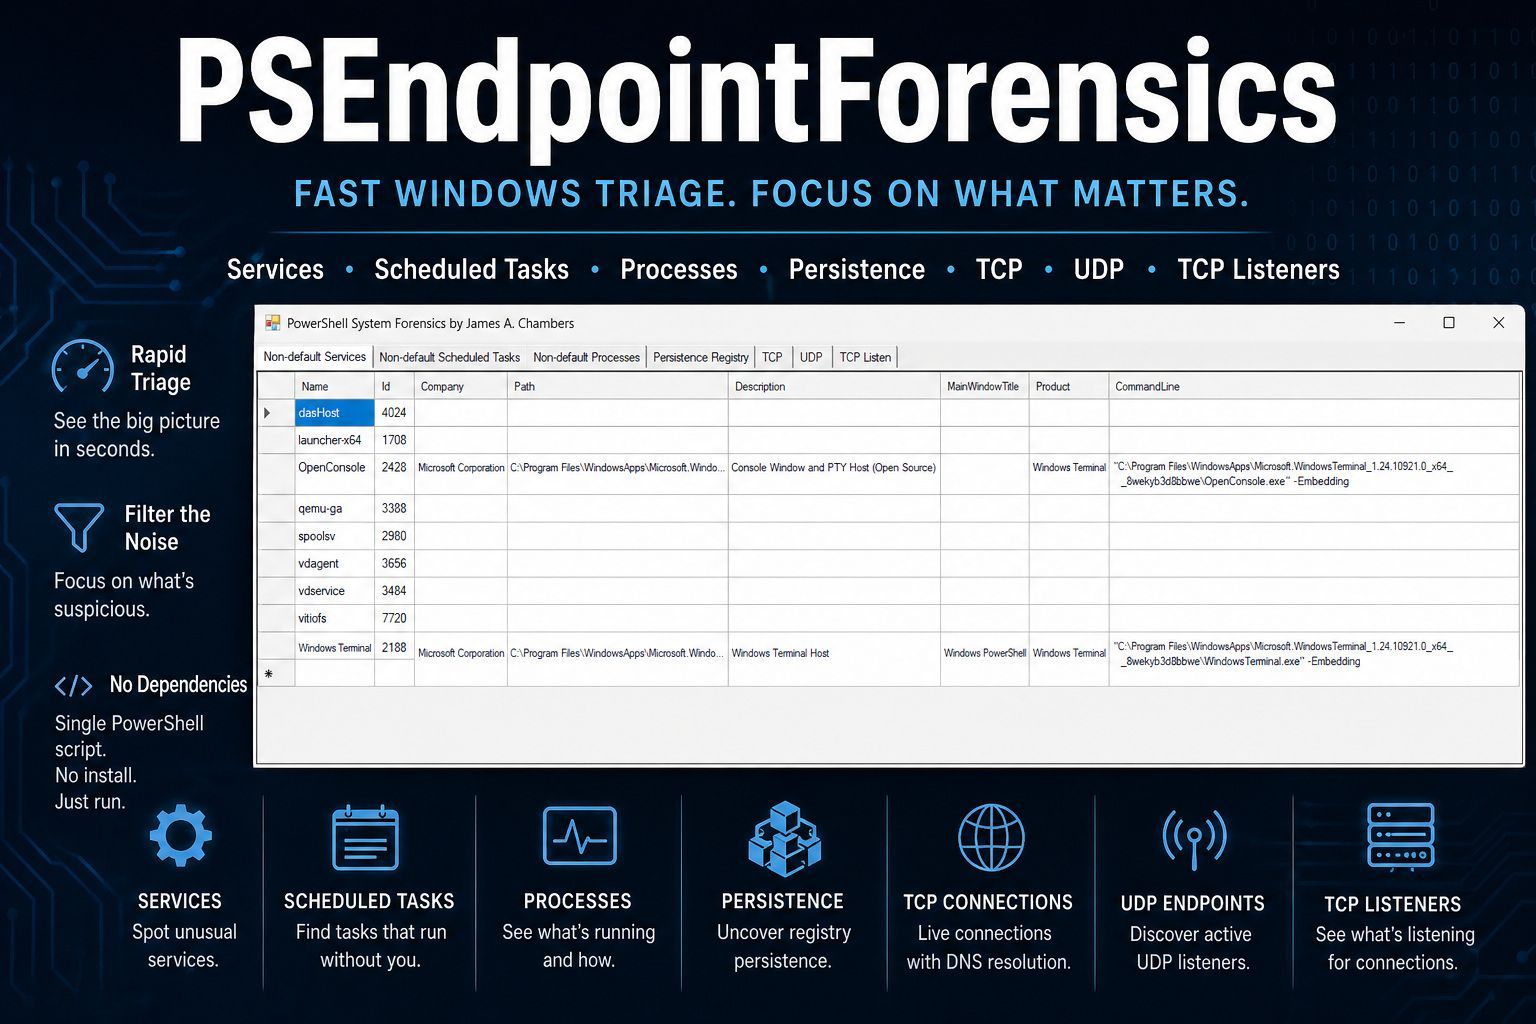
That’s exactly why I built PSEndpointForensics.
What It Is
PSEndpointForensics is a PowerShell-based forensic triage tool for live Windows systems. It collects high-value endpoint artifacts and presents them in a clean, tabbed GUI designed for fast investigation.
Instead of forcing analysts to run multiple commands, pivot between tools, or sift through thousands of lines of output, it gives you seven focused views of system state.
Each one is built built to answer the same question:
What on this machine deserves immediate attention?
The entire tool lives in a single .ps1 file with no external dependencies.
No installers. No PowerShell modules. No NuGet packages. No compatibility headaches.
It runs on:
- Windows PowerShell 5.1
- PowerShell 7+
…and relies only on built-in cmdlets and standard .NET Framework assemblies already present on the system.
Copy one file. Run it. Start investigating.
The Seven Views
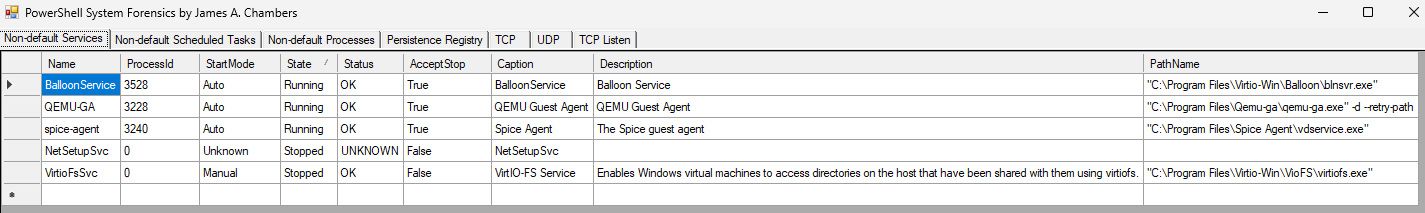
Non-default Services
Every Windows system has dozens (sometimes hundreds) of built-in services.
Most of them are boring. They also stop you from seeing what might not be boring.
This tab focuses on what matters: services that aren’t part of the normal Windows baseline.
Using WMI, PSEndpointForensics enumerates installed services and filters out common Microsoft noise like Windows services, Edge components, and other expected defaults. What remains are the third-party and unusual services that deserve a second look.
Each entry includes:
- Service name
- Process ID
- Startup mode
- Current state
- Description
- Full executable path
That path is often where the real story begins.
Non-default Scheduled Tasks
Scheduled tasks remain one of the most common persistence mechanisms used by attackers.
This tab surfaces all registered tasks while filtering out the massive amount of default Microsoft Windows and Edge task noise.
Instead of drowning in system tasks, you immediately see the tasks that matter.
Each entry shows:
- Task name
- Task path
- Author
- Current state
- Trigger details
- Description
If something is set to execute later, you’ll find it here.
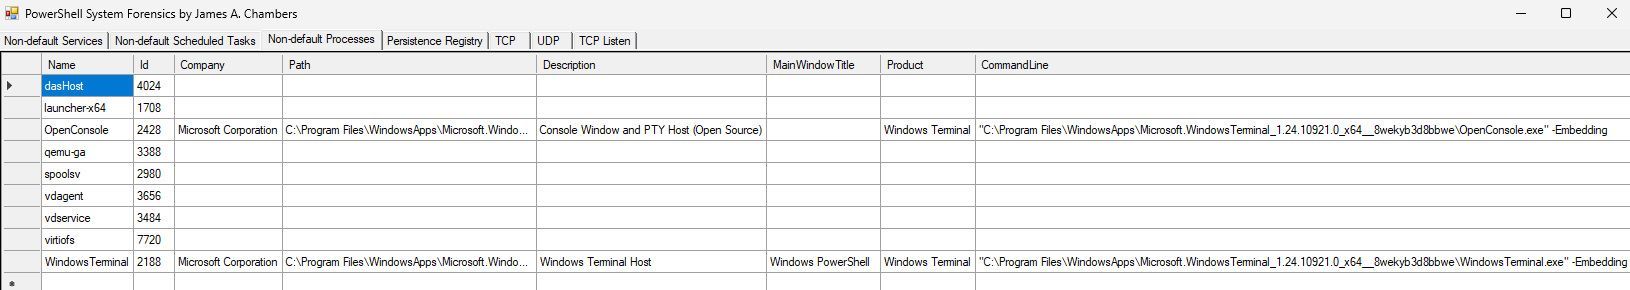
Non-default Processes
Process listings alone rarely tell the full story.
Seeing svchost.exe isn’t useful.
Seeing a suspicious binary launched from C:\Users\Public\ with a strange command line absolutely is.
This tab displays running processes that are not standard Microsoft OS components and enriches them with full command-line resolution using WMI.
Each process includes:
- Name
- Process ID
- Company
- Description
- Full path
- Product name
- Command line
The command line is often the difference between “probably fine” and “definitely investigate.”
Persistence Registry
Registry persistence is where attackers love to hide.
This tab focuses on known persistence locations across both HKLM and HKCU, including:
- Run / RunOnce keys
- RunOnceEx
- Group Policy Explorer Run keys
- Wow6432Node autoruns
- IFEO debugger hijacks
- Winlogon persistence
- Session Manager persistence paths
Rather than dumping entire noisy registry branches like Winlogon or Session Manager, the tool only checks persistence-relevant values such as:
ShellUserinitBootExecuteSetupExecutePendingFileRenameOperationsDebugger
This dramatically reduces noise and makes suspicious entries stand out immediately.
Each entry shows:
- Hive
- Full registry path
- Value name
- Value data
This tab is one of the fastest ways to answer:
Why does this keep coming back after reboot?
TCP Connections

This provides a live view of all established TCP connections mapped directly to owning processes.
You can immediately see:
- Local address and port
- Remote address and port
- Connection state
- Owning process
- Process name
The standout feature here is the Resolve DNS button.
When clicked, the tool launches asynchronous reverse-DNS lookups for every remote IP and appends the resolved hostname directly into the grid.
UDP Endpoints
UDP listeners are easy to forget during fast triage. Attackers know that.
This tab shows active UDP endpoints along with the owning process while filtering out common system noise.
It’s simple, but valuable. Especially when malware decides not to use TCP.
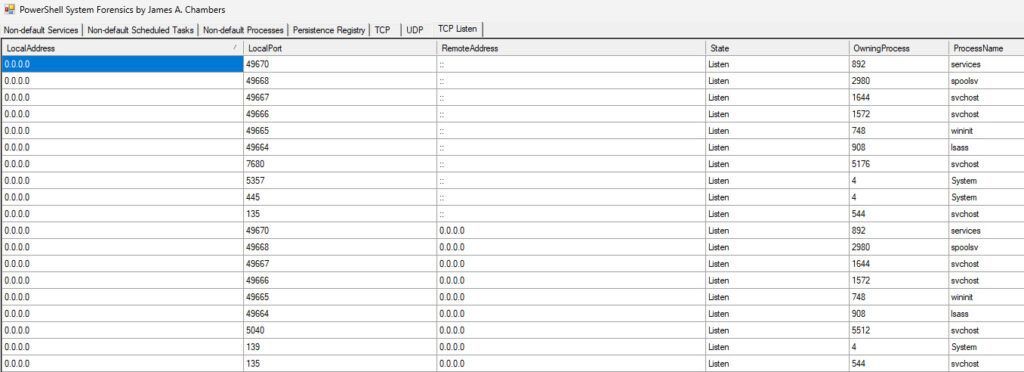
TCP Listeners
This tab answers one of the most important triage questions:
What is waiting for inbound connections on this machine?
It displays every TCP socket in the LISTEN state and maps each port to its owning process.
If something is exposing a service, opening a backdoor, or listening when it shouldn’t be you’ll see it here.
Design Decisions
A few choices were intentional.
GUI Over Console
Forensic triage is visual. The WinForms DataGridView control allows you to:
- Sort instantly
- Resize columns
- Reorder fields
- Compare values side-by-side
That’s far more useful than watching text scroll past in a terminal and having to filter out the noise.
Filter at the Source
Most tools dump everything and leave the analyst to clean it up.
That’s backwards.
PSEndpointForensics removes known-good Windows noise upfront so the unusual stands out immediately.
The goal is not completeness. The goal is faster detection and filtering out noise.
No Dependencies
The tool uses only what already ships with Windows.
No installation. No setup. No “works on my machine.”
Just run it.
Point-in-Time Snapshot
The tool captures the system exactly as it exists when launched.
That makes it useful for:
- Before/after comparisons
- Rapid incident triage
- Evidence correlation
- Screenshot-based reporting
Sometimes the fastest answer is simply seeing the state of the machine right now.
How to Use It
Drop the script onto a Windows endpoint, open an elevated PowerShell session, and run:
.\PSEndpointForensics.ps1The console will show progress as each data category loads.
Once complete, the GUI opens and presents a consolidated forensic snapshot of the system.
On the TCP tab, click Resolve DNS if you want hostname resolution for remote connections.
Everything else is collected automatically at launch.
Get It
The tool is available on GitHub at:
https://github.com/TheRemote/PSEndpointForensics
What is PSEndpointForensics and who is it for?
PSEndpointForensics is a standalone PowerShell utility that accelerates live endpoint triage. It filters out standard Microsoft OS noise and presents a visual WinForms dashboard of suspicious services, scheduled tasks, persistence registry keys, and active network sockets.
Does PSEndpointForensics require PowerShell 7 or external dependencies?
No, it runs natively on both Windows PowerShell 5.1 and PowerShell 7+. It uses zero external packages, relying entirely on built-in WMI queries, standard cmdlets, and native .NET assemblies.
How does PSEndpointForensics detect persistence mechanisms?
It scans standard autorun registry locations (
Run,RunOnce,Wow6432Node,IFEO) and monitors critical execution values likeShell,Userinit,BootExecute, andPendingFileRenameOperationsfor third-party executables.

")
 Using PowerShell / Uploading CSV Files")

